From time-to-time as with your PC, Mac or any other mobile platform, you will have an app that misbehaves. It doesn’t load or it crashes or, worst case, it loads and runs but consumes a huge amount of memory on your device. This is often referred to as a memory leak and it can cause other apps to misbehave and for your device to run sluggishly. In Android Marshmallow there is a way to see not only the amount of memory you have available on your device but also the ability to see individual apps and the amount of memory they are consuming. If you have an app that is consuming all your available memory, you can even force it to stop so you can regain the memory.
To start, go to Settings>Memory on your Android Marshmallow phone or tablet. There you will see a bar graph with the average amount of memory that has been used on your device for the last 3 hours. You can adjust that time frame to 6 or 12 hours or for a day if you so chose but if you are running into sluggishness and you suspect an app is the culprit, the 3 hour view is usually the one you will need. To change the time frame, use the pull down menu next to where it says 3 hours.
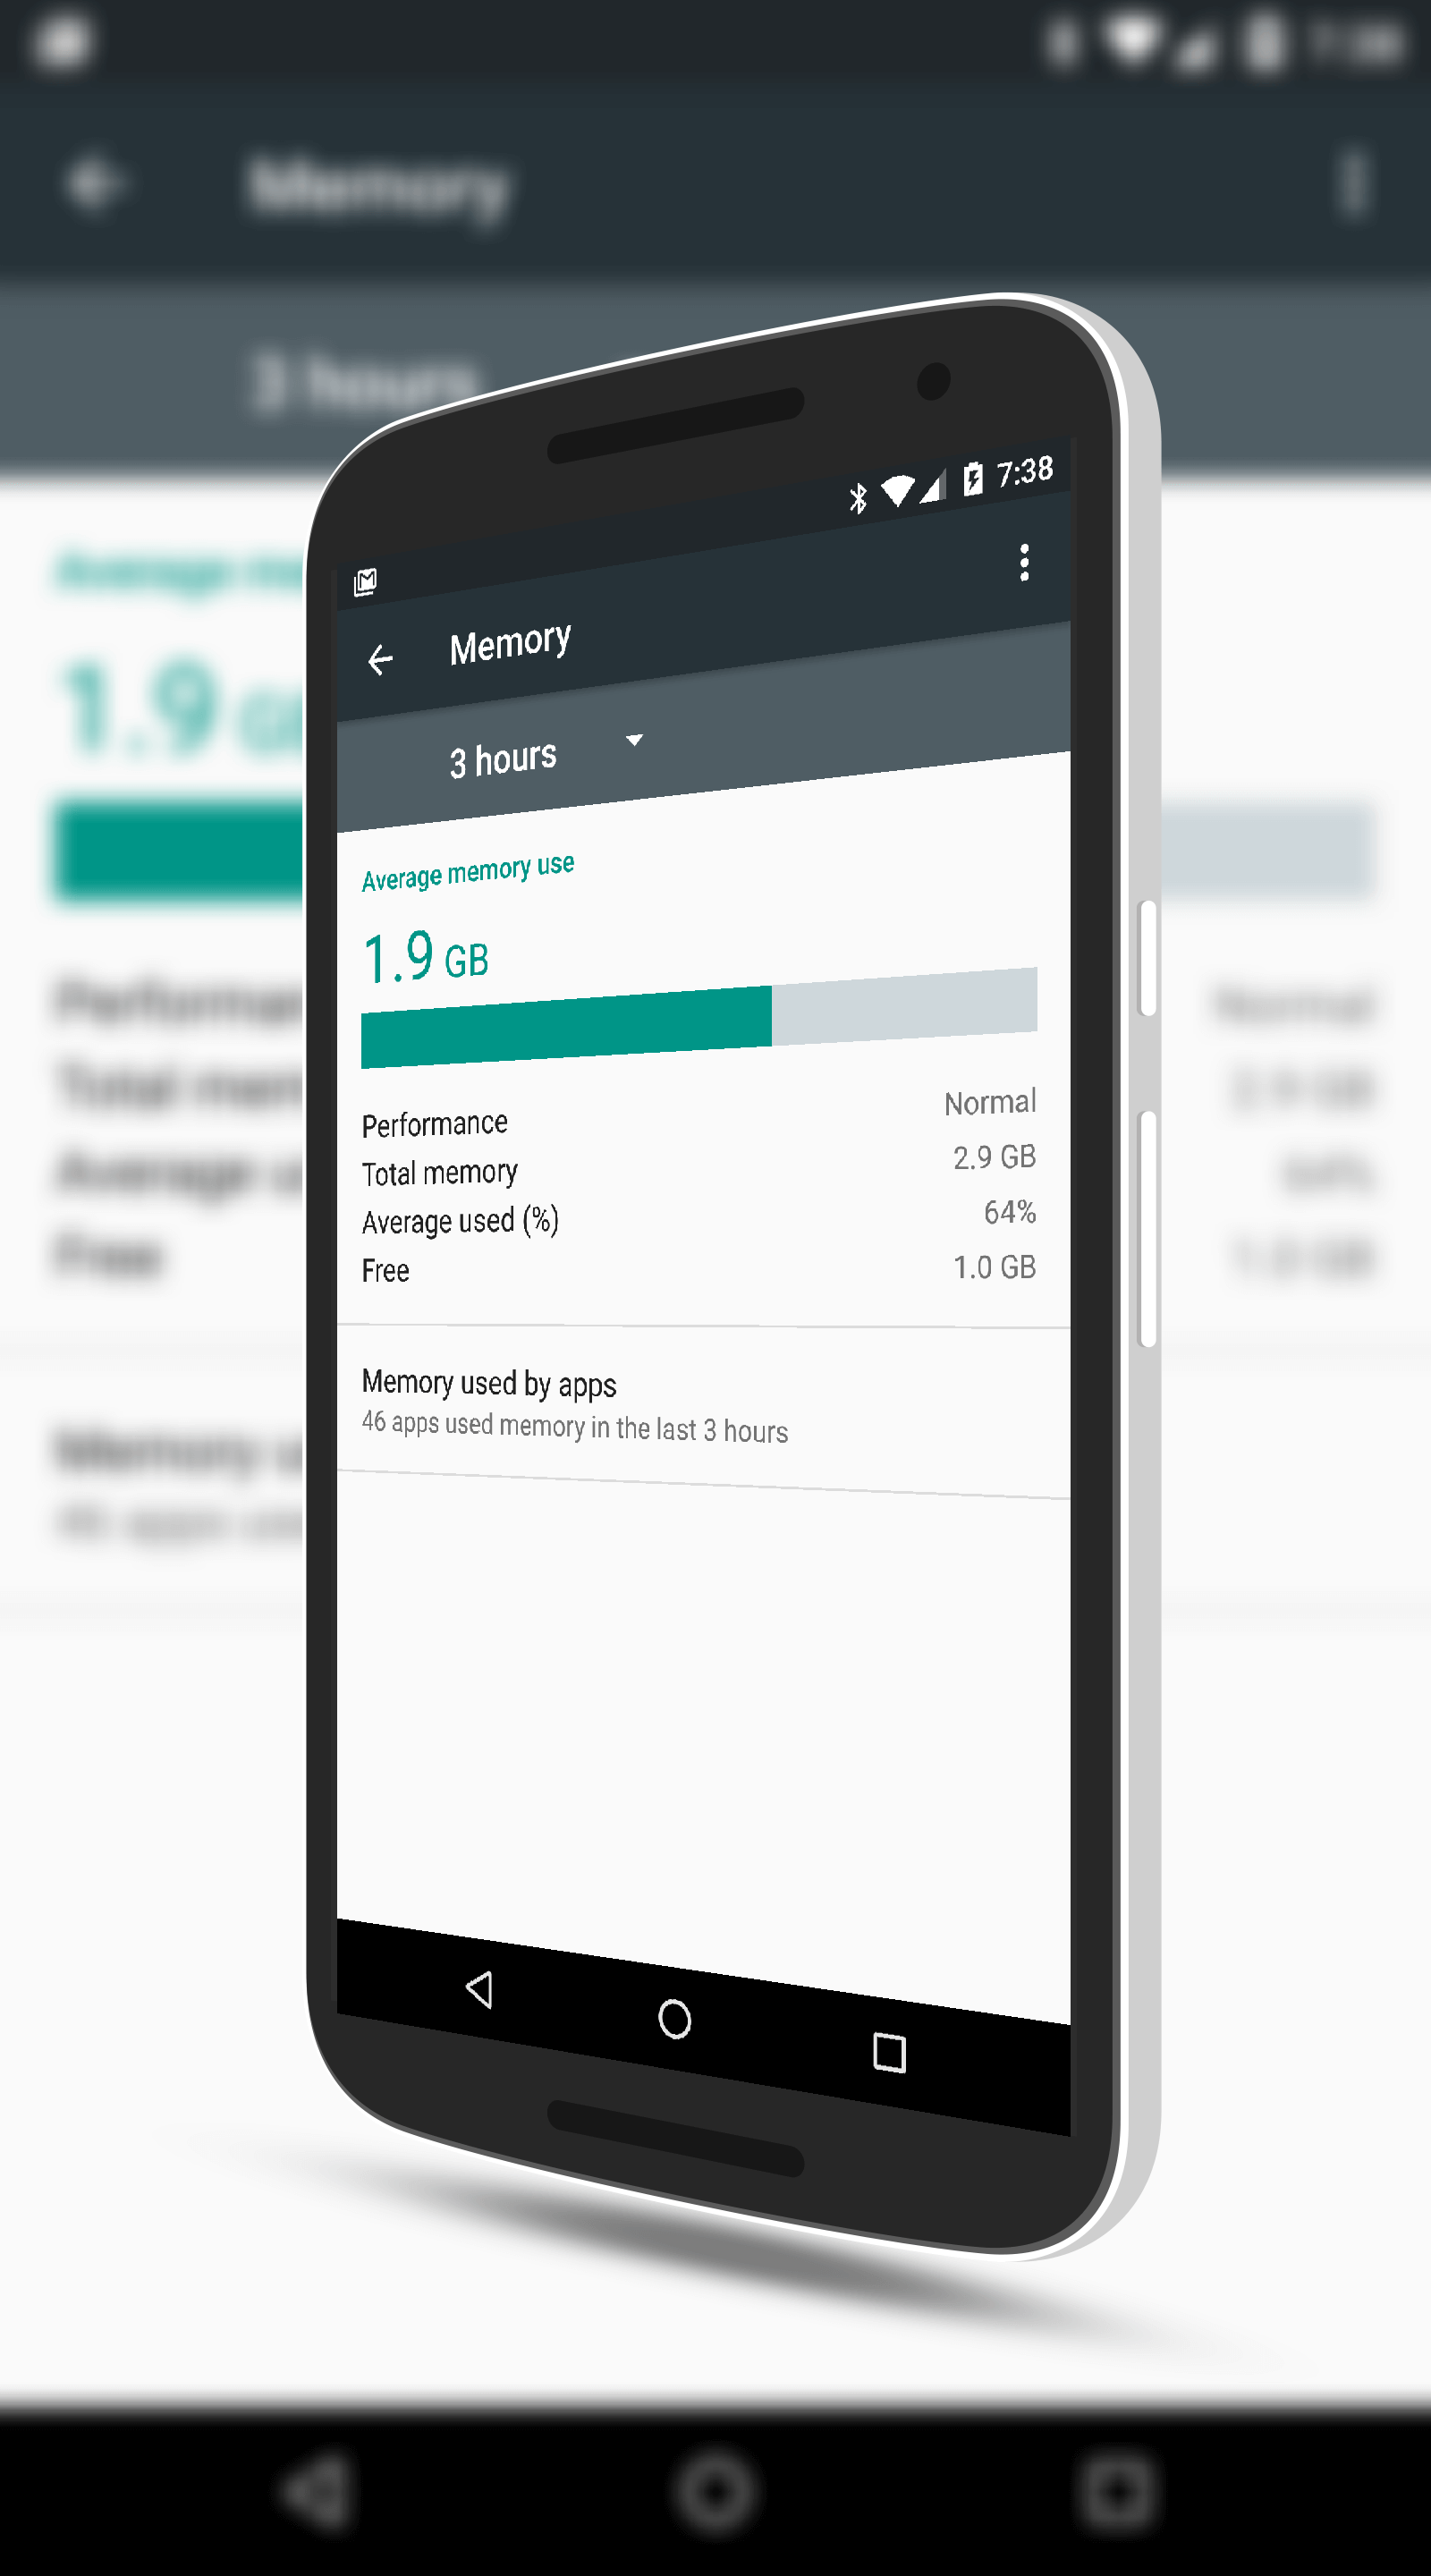
Memory Usage in Android Marshmallow
Below the bar graph you will find a good amount of information about the memory (RAM) in your phone or tablet. You will see how it is performing, the total amount of memory available, the average percentage of that memory used and the amount of free memory you have currently. If you have ever been curious as to just how much RAM is on your particular phone, now you know where to find out.
Further down the page you will see a section “Memory used by apps” and it will tell you the number of apps that have used memory in the last 3 hours. This is the section we are interested in for this How To. Tap on that section and you will open up a page that displays all of the apps that have consumed memory in the last 3 hours (or whatever time frame you have set). You will see not only apps that you have installed, but also Android system apps like Android OS, Android System, System UI, etc.
The trick to finding a memory leaking app is to look at the top of this list and see which app you have installed that has consumed a lot of memory. Most apps beyond the Android system apps are going to consume 300MB or less on average (that’s not a 100% fact but a general guideline) so if you see an app that is consuming over that, chances are it may be the culprit app. To test it, tap on the app then use the 3-dot menu in the upper right corner to Force Stop the app. That essentially purges it from memory on your device. Now re-start that app, let it run for a bit and then come back to this section in Settings. If you see that it has rapidly climbed in memory
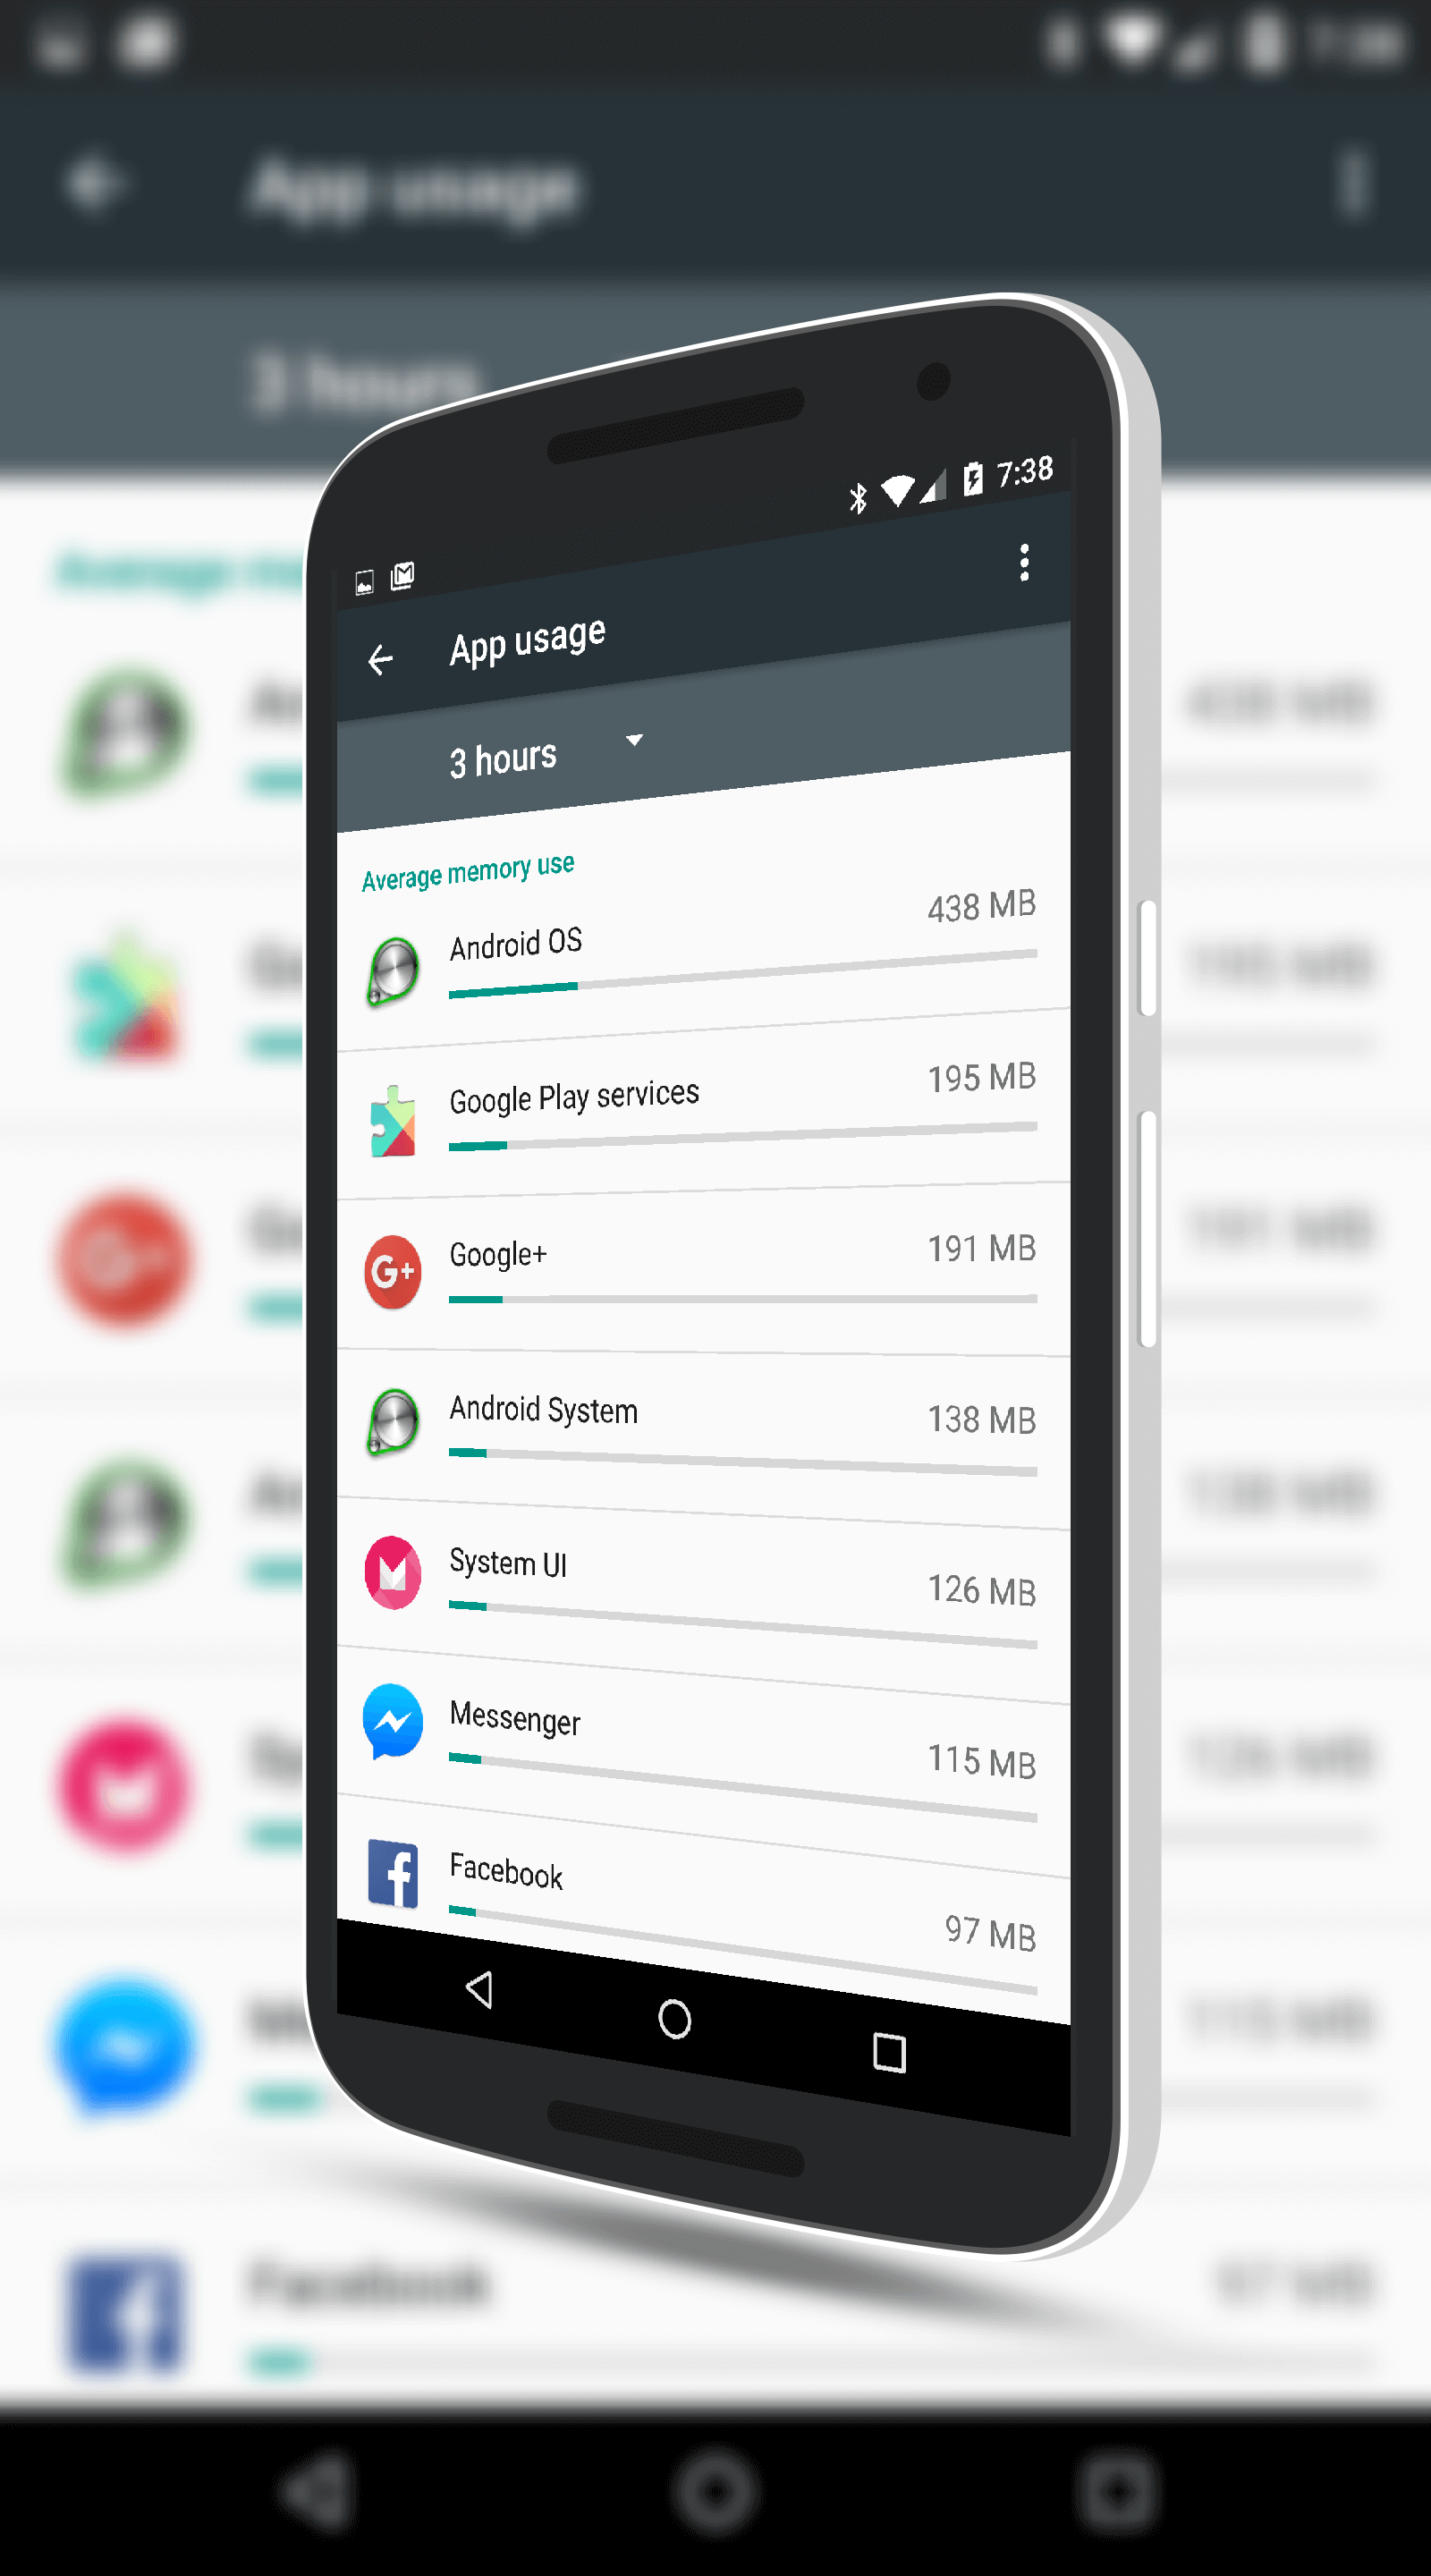
Apps List of Memory Consuming Apps
consumption, especially in 15-20 minutes, then you likely have found your culprit.
What to do next is really up to you. If you know there is an update out, get that update (or check in the Google Play Store) as the developer may be aware of the issue already and released an update. If not, you should contact the developer and provide as much information as possible on the leak. Contrary to popular belief, developers actually do want to hear from users, especially if they are experiencing a problem with their app. Give them a chance to fix it. Finally, there is always the “nuclear option” which is to uninstall the app and wait for an update to be released that hopefully fixes the issue.
For more How To’s and other tips for Android, Chrome OS and Chrome, be sure to check out the How To’ Pages