Fitbit has rolled out a pretty nice albeit minor update to their Android app this week. The update, version 2.37 for those keeping score at home, has some improved charts and graphs for body mass and weight history. While most people tend to think of Fitbit as an activity tracker – which they do well – their app is actually fairly comprehensive when it comes to tracking things like your diet, weight, water consumption and, of course, exercise. This update mainly focuses on providing you a bit more information around your weight and body composition.
First, there is an updated body lean mass versus fat mass graph. With this you can better visualize your body composition based on the inputs that your provide to the app for your weight and fat mass measurements. This information, if you have the Aria scale, can be automatically synced to the app so you can see your lean mass versus fat mass in the app.
Second, the weight graph has been updated to provide you a view of your lifetime progress. Previously you could only view up to
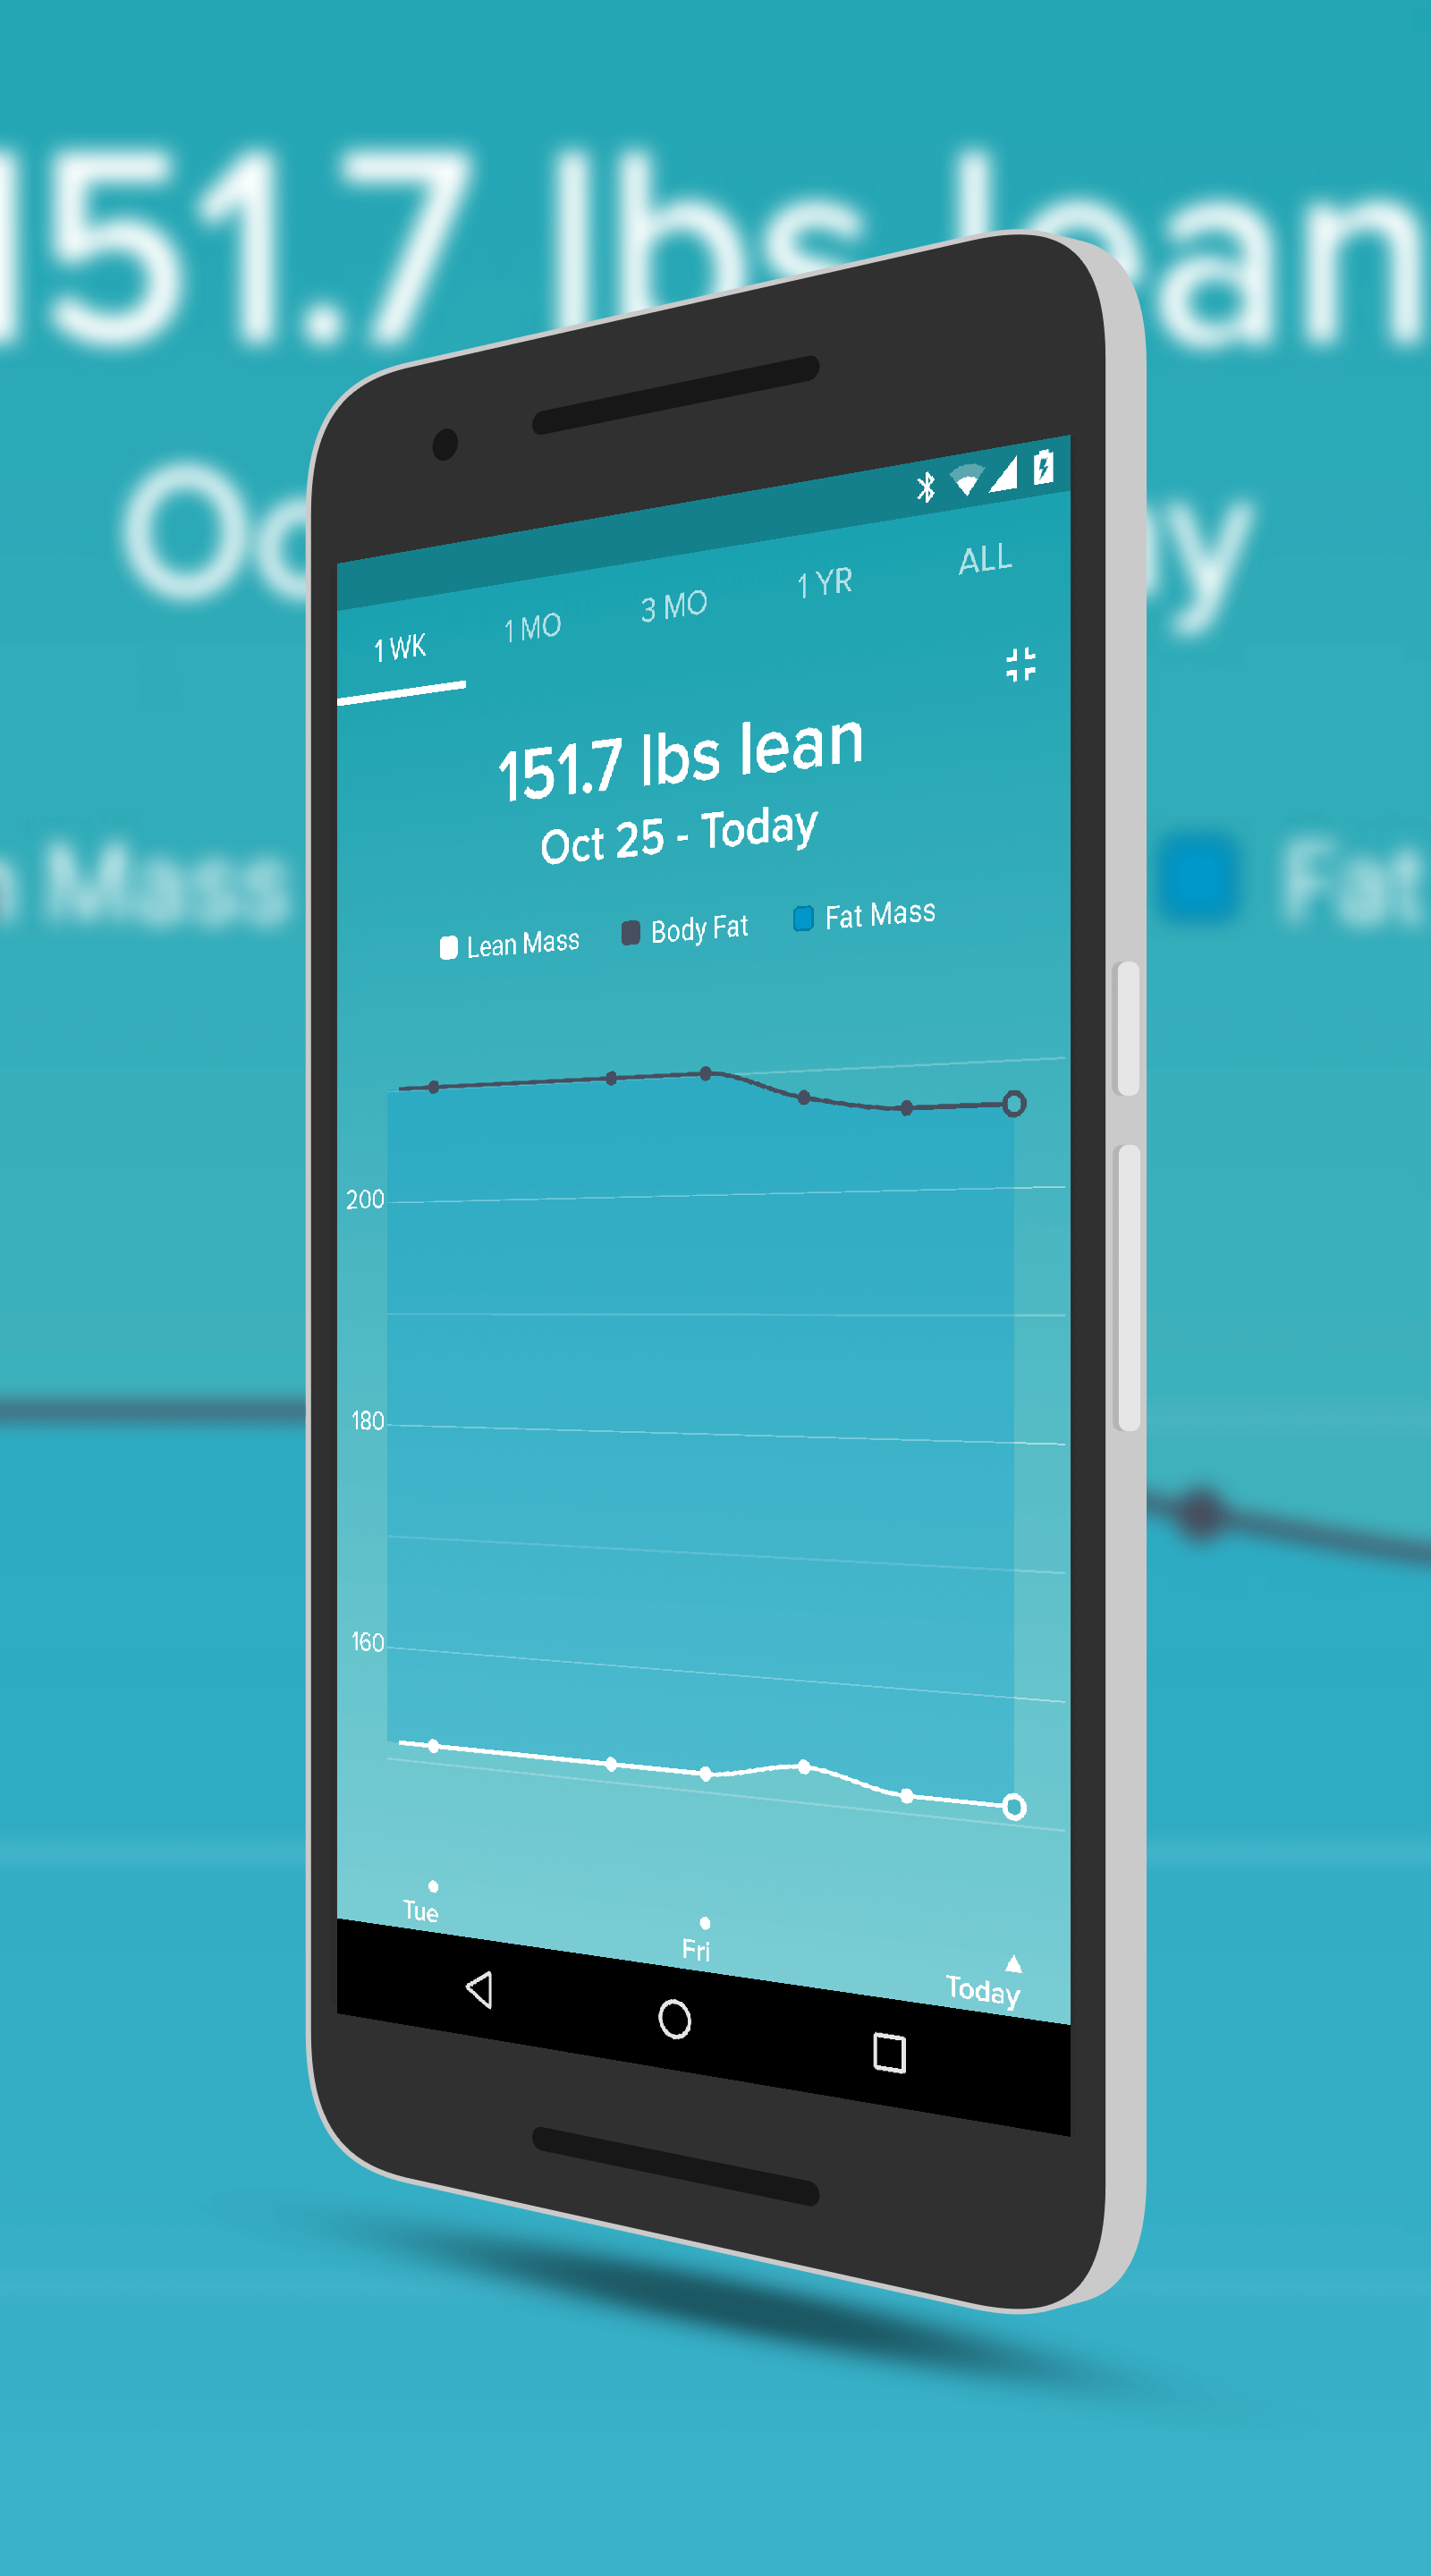
Fitbit Body Mass Charts
a year of your weight loss/gain progress in the app. Now, if you have been using Fitbit longer than a year, you can see your lifetime results. It is a great way to visualize how you have been doing over the course of time.
The Fitbit app is a free app and trackers range from $99-$299. You can use your Android phone as your tracker to keep tabs on the basics (steps, miles walked) but the full richness of the app will come with a tracker purchase. You can check out the full lineup on Amazon where most of them include free shipping for Prime customers.